Performance Analytics

Performance Analytics
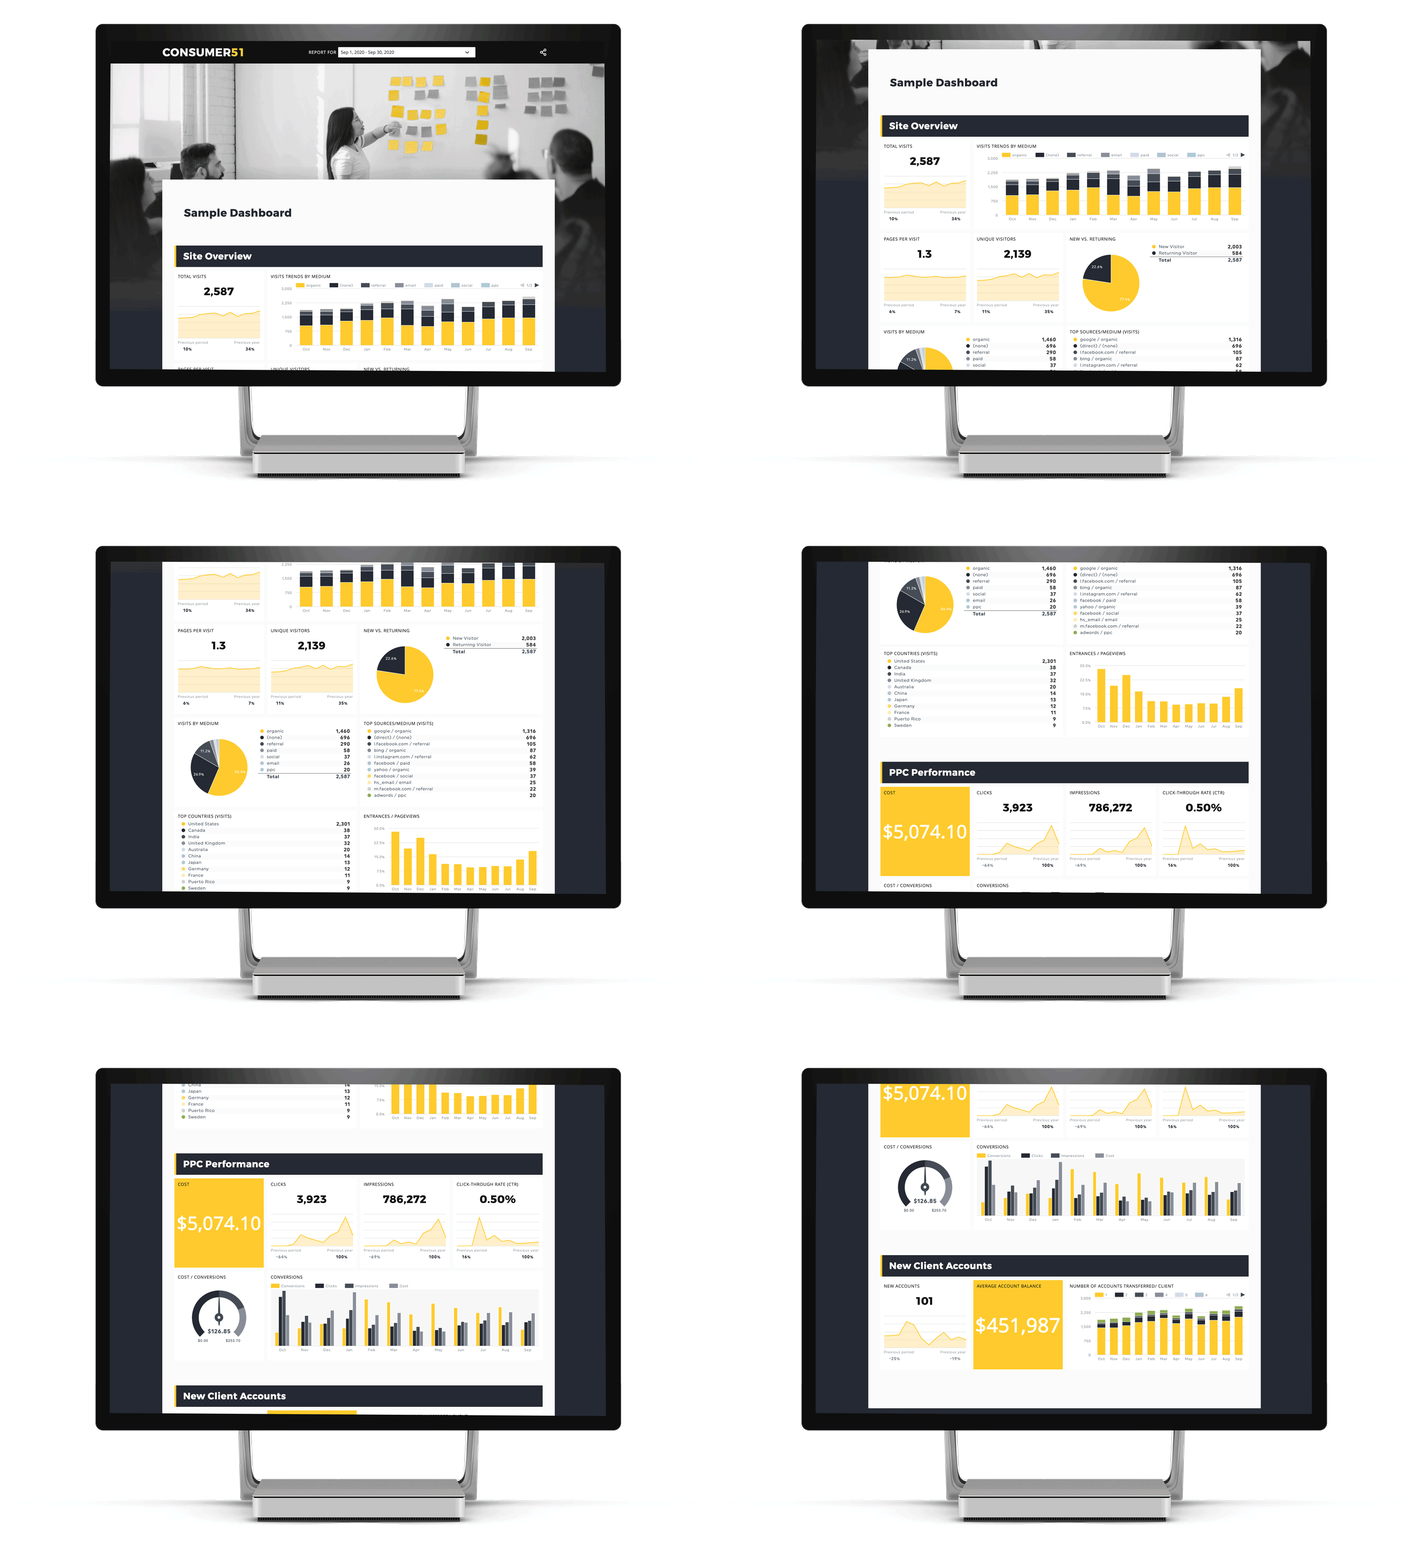
Our customizable all-in-one live analytics dashboard pulls data from all of your communications campaigns and displays them live in one place.
You can see campaign results in real-time across all platforms anytime you need.
Whether we run all of your campaigns or you are working with several outlets, you can find all your data on a single dashboard at any given time.
UX/UI analysis from the given data to improve your user’s experience and ultimate conversions.
Performance Analytics
Quantifiable insight so you can plan ahead with confidence.
Performance Dashboard
$
99
/mo
-
Monthly dashboard to provide analytic updates: Ad performance, SEO progress, website analytics, social analytics, Google My Business
-
Ongoing recommendations to assist in the performance of your digital assets: Make KWs work harder, better conversion rates, increase your website traffic, and improve engagement on social platforms
-
Performance summary from our certified marketing representatives
what our clients have to say.
My business was doing well but I knew I needed to get something online before the slow season started. Starup51 made the process easy and the site came out great!
TerryLandscape Architect
Referrals had grown my company for 5 years, but I knew I could be doing more. Working with Startup51 to run Google Search ads was simple to set up and we started seeing results from our campaigns faster than I expected. Now I recommend Startup51 to all of my clients.
RebeccaSmall Business Consultant
I love my new website! I spent months trying to do it myself but never liked how it came out. Startup51 was so stress-free to work with and my site came out amazing!
AmandaFamily Nurse Practitioner
The Benefits.
Award-winning Designers
Stress-Free process
Marketing That really works
Affordable Pricing
SEO experts

e-commerce Made easy
Understand your analytics
A system that works
Safe and secure hosting
Start today!
FAQs
The StartUp51 performance analytics plan is designed to provide you with analytic updates on various aspects of your digital marketing performance. It offers a comprehensive overview of your ad performance, SEO progress, website analytics, social analytics, and Google My Business insights.
Data Integration: Our dashboard will integrate with various data sources, including Google Analytics, social media platforms (such as Facebook, Twitter, and Instagram), advertising platforms (such as Google Ads, Facebook Ads), and more, as per the sources that you help us add onto your dashboard. The dashboard pulls data from these sources to provide a centralized view of your key performance indicators (KPIs) in one dashboard.
Real-Time Data Updates: Your performance analytics dashboard will automatically pull the latest data from your integrated sources. You will always have access to up-to-date information, allowing you to monitor performance and make informed decisions in real time.
Visual Representation: The dashboard presents data in a visually appealing and easy-to-understand format. It utilizes charts, graphs, tables, and other visual elements to illustrate trends, comparisons, and performance metrics. This visual representation helps you quickly grasp key insights and identify areas that require attention.
KPI Tracking: The dashboard will allow you to track your chosen KPIs in a single dashboard. You can select relevant metrics, such as website traffic, conversion rates, social media engagement, and more, to monitor your progress toward your business goals. This centralized view enables you to assess performance across different channels and campaigns.
Data Export: The dashboard would allow you to export data in various formats, such as PDF, Excel, or CSV.
Data Security: We prioritize data security above all and ensure your data remains safe. The third-party dashboard platform that we use secures connections and follows industry-standard security protocols to protect your data and maintain privacy.
In short, we offer a user-friendly and customizable dashboard that integrates data from various sources, presents it visually, tracks KPIs, and provides automated reporting features to help you monitor and analyze your digital assets’ performance effectively.
While you can access the dashboard anytime and see how your digital assets are performing in real-time, StartUp51 would do the analysis and put in the recommendations once a month. The recommendations appear in a designated space in the dashboard by the fifth working day of every month.
The dashboard’s ad performance section provides key metrics and insights related to your advertising campaigns. It includes data on impressions, clicks, click-through rates (CTRs), conversions, and other relevant performance indicators. This information helps you gauge the effectiveness of your ad campaigns.
In the SEO progress section, you will find updates on the progress of your search engine optimization efforts. It includes information on keyword rankings, organic traffic, backlinks, and other SEO-related metrics. These insights allow you to track the performance of your website on search engine results pages. Here are a few concepts that you may find useful:
- Keyword Rankings: Keyword rankings show where your website appears in search engine results for specific keywords or phrases. Monitoring keyword rankings helps you assess the visibility of your website and how well it is optimized for relevant search queries.
- Organic Traffic: Organic traffic refers to the visitors who land on your website through unpaid, organic search results. Tracking organic traffic helps you understand the effectiveness of your SEO efforts in attracting relevant visitors from search engines.
- Backlinks: Backlinks are links from other websites that point to your website. They play a crucial role in SEO, as search engines consider them a vote of confidence and authority for your website. Monitoring backlinks helps you assess the quality and quantity of links pointing to your site, which can impact your search engine rankings.
- SEO-related Metrics: SEO-related metrics encompass various factors that influence your website’s performance in search engine results. These metrics may include domain authority, page load speed, mobile responsiveness, and on-page optimization. Monitoring these metrics provides insights into your website’s overall health and optimization.
Reviewing the SEO progress section, you can evaluate how well your website performs in search engine results pages. It helps you identify improvements in keyword rankings, gauge the impact of your SEO efforts on organic traffic, assess the quality and quantity of backlinks, and overall track the effectiveness of your SEO strategy. These insights allow you to make informed decisions to enhance your website’s visibility and increase organic search traffic.
The website analytics section offers detailed data about your website’s performance and visitor behavior. It includes metrics like website traffic, bounce rate, average session duration, conversion rates, and more. This data helps you understand how users interact with your website and identify areas for improvement. Here are a few concepts that you may find useful:
- Website Traffic: Website traffic refers to the number of visitors or users who visit your website within a specific time period. It helps you understand the overall popularity and reach of your website.
- Bounce Rate: The bounce rate indicates the percentage of visitors who leave your website after viewing only one page without taking any further action or navigating to other pages. A lower bounce rate is generally desirable as it suggests that visitors are engaging with your content and exploring your website further.
- Average Session Duration: Average session duration measures the average amount of time visitors spend on your website during a single session. It provides insights into how engaging and valuable your content is and how well your website holds visitors’ attention.
- Conversion Rates: Conversion rates track the percentage of website visitors who complete a desired action, such as purchasing, filling out a form, or subscribing to a newsletter. It helps you evaluate your website’s effectiveness in achieving your business goals.
Areas for Improvement: Analyzing the above metrics helps you identify areas on your website that need improvement. For example, if the bounce rate is high, you may need to improve the user experience or the relevance of your content. If the average session duration is low, you may need to enhance the quality of your website’s content or design. By understanding how users interact with your website, you can make informed decisions to optimize the user experience and drive better results.
The social analytics section provides valuable insights into your social media performance. It includes metrics like followers, engagement rates, reach, and conversions driven by social platforms. These insights help you evaluate the effectiveness of your social media strategy and make data-driven decisions to improve engagement and ROI. Here are a few concepts that you may find useful:
- Followers: Followers represent the number of individuals or accounts that have chosen to subscribe to and receive updates from your social media profiles. Tracking the number of followers helps you understand the size of your social media audience and the potential reach of your content.
- Engagement Rates: Engagement rates measure the level of interaction and involvement your social media content generates. It includes actions like likes, comments, shares, and clicks. Monitoring engagement rates helps you gauge the effectiveness of your content in capturing audience attention and fostering meaningful interactions.
- Reach: Reach refers to the total number of unique individuals who see your social media posts or content. It provides insights into the visibility and exposure of your messages across social media platforms. Increasing reach allows you to expand your brand’s presence and potentially reach new audiences.
- Conversions: Conversions are actions that users take on social media that align with your business goals. These actions could include purchasing your product or service, signing up for a newsletter, downloading a resource, or any other desired action. Tracking conversions driven by social platforms helps you assess the effectiveness of your social media strategy in driving tangible results and achieving your business objectives.
By analyzing the above metrics, you can evaluate the effectiveness of your social media strategy. You can assess the growth of your follower base, measure the level of engagement your content generates, determine the reach of your social media messages, and track conversions driven by your social media efforts. These insights enable you to make data-driven decisions to improve engagement, enhance your social media strategy, and maximize your social media activities’ return on investment (ROI).
The Google My Business section offers updates on your business’s presence in Google’s local search results. It includes data on customer actions, such as website visits, direction requests, and phone calls. You can also track customer reviews and ratings to monitor and enhance your online reputation. Here are a few details about Google My Business that you may useful:
Google My Business (GMB) is a free online tool provided by Google that helps businesses manage their online presence and appearance in Google search results. Here are a few key points about Google My Business:
- Business Profile: GMB allows businesses to create and manage their business profile on Google. This profile includes essential information such as business name, address, phone number, website, operating hours, and more.
- Local Search Results: A verified and optimized GMB profile increases the chances of your business appearing in local search results. When users search for businesses or services related to their industry in a specific location, your GMB profile may appear in the local map pack or local knowledge panel.
- Customer Reviews and Ratings: GMB allows customers to leave reviews and ratings about your business. These reviews contribute to your online reputation and influence potential customers’ decision-making. Responding to positive and negative reviews shows that you value customer feedback.
- Photos and Videos: GMB enables businesses to showcase their products, services, and premises by uploading photos and videos to their profile. Visual content helps attract potential customers and gives them a glimpse of what to expect from your business.
- Google Maps Integration: With GMB, your business is listed on Google Maps, making it easier for customers to find your physical location. It provides directions, helps users navigate to your establishment, and increases foot traffic.
- Insights and Analytics: GMB provides valuable insights and analytics about how customers interact with your profile. You can track the number of views, searches, and actions users take, such as website visits, phone calls, and direction requests. These insights help you understand customer behavior and make data-driven decisions to improve your online presence.
- Posts and Offers: GMB allows businesses to create posts and offers to engage with customers directly on the search results page. These posts can highlight promotions, events, new products, or any other relevant information you want to communicate to your audience.
- Mobile Presence: GMB also enhances your mobile presence, making it easier for users to find your business on their smartphones. Mobile users can quickly access your contact information, view photos, read reviews, and get directions to your location.
- Integration with Other Google Services: GMB integrates with other Google services such as Google Ads and Google Analytics. This integration allows you to leverage data and insights from multiple platforms to optimize your marketing efforts and track the performance of your online presence.
- Multi-location Management: For businesses with multiple locations, GMB offers tools to manage and update information across all locations from a single dashboard. This streamlines the management process and ensures consistency in your online presence.
Overall, Google My Business is a powerful tool that helps businesses improve their visibility, engage with customers, and manage their online reputation on Google’s search engine and maps.
StartUp51 will provide recommendations once a month in a particular section of the dashboard based on the insights from the monthly performance data that the dashboard pulls. These recommendations will aim to improve the performance of your digital assets, including optimizing keywords to increase their effectiveness, enhancing conversion rates on your website, driving more traffic to your site, and improving engagement on your social media platforms.
Via the Performance Analytics dashboard, StartUp51 will suggest improvements to make your keywords more effective. This may include optimizing keyword targeting, expanding keyword variations, refining ad copy, and ensuring alignment between keywords and landing page content. These strategies will help you maximize the impact of your keywords and improve overall campaign performance.
StartUp51 will analyze your dashboard results and, based on the same, identify areas of improvement as applicable at the time to your conversion funnel, landing pages, and user experience. If required, via the recommendations mentioned in the StartUp51 dashboard, StartUp51 would help optimize landing page design, call-to-action placement, form optimization, and other conversion rate optimization techniques. By implementing these suggestions, you can increase the likelihood of visitors taking desired actions on your website.
The StartUp51 Performance Analysis Dashboard, with its metrics and accompanying monthly recommendations, from StartUp51 can play a crucial role in helping your business increase its social engagement and prospects. Here are a few points on how to achieve the same:
- Identifying High-Performing Content: The analytics dashboard can provide insights into the types of social media content that generate high levels of engagement. Businesses can identify the content that resonates most with their audience by analyzing metrics such as likes, comments, shares, and click-through rates. This information can guide them in creating more engaging and shareable content, leading to increased social engagement and exposure to a wider audience.
- Optimal Timing and Frequency: The analytics dashboard can reveal the most active times and days when the target audience is online and engaged on social media platforms. By identifying these optimal timings, businesses can schedule their social media posts to reach a larger audience and increase the likelihood of engagement. Similarly, the dashboard can help determine the ideal posting frequency to maintain a consistent presence without overwhelming the audience. Finding the right balance can lead to higher social engagement and increased visibility.
- Targeted Advertising and Audience Segmentation: The analytics dashboard can provide valuable insights into the audience’s demographics, interests, and behavior engaging with the business’s social media content. The information can help to create targeted advertising campaigns and refine audience segmentation strategies. By delivering relevant content and advertisements to specific audience segments, businesses can increase social engagement and attract prospects more likely to convert into customers.
- Continuous Improvement and Optimization: The analytics dashboard provides businesses with ongoing performance data and insights. By regularly monitoring and analyzing this data, you can identify trends, patterns, and areas for improvement. The recommendations derived from analytics can guide in optimizing the social media approach, refining content, experimenting with different tactics, and adapting to changing trends. This iterative improvement process can enhance social engagement and attract more business prospects.
In summary, StartUp51 performance analytics and recommendations help your businesses increase social engagement and prospects by identifying high-performing content, optimizing timing and frequency, enabling targeted advertising and audience segmentation, and guiding continuous improvement and optimization efforts.


